// MLC Isometric Heatmap v1.2.2
MLC Isometric Heatmap — Time Series as Isometric 3D Terrain
// Gallery
// Features
Why choose MLC Isometric Heatmap.
Renders 2D matrix data and time series into readable 3D landscapes where height and color encode value.
No Canvas, no WebGL, no runtime bloat. Emits pure SVG strings that scale from mobile screens to posters.
Choose between continuous terrain meshes, prisms, cylinders, or floating Bezier ribbons.
Ships with preset palettes (Sunset, Emerald, Sky, Coral) and smooth SVG gradient interpolation.
Hover effects and value tooltips are baked directly into the SVG using pure CSS and title tags.
Full online manual featuring 45 interactive live examples and ready-to-use code snippets.
// Continuous 3D Mesh Terrain
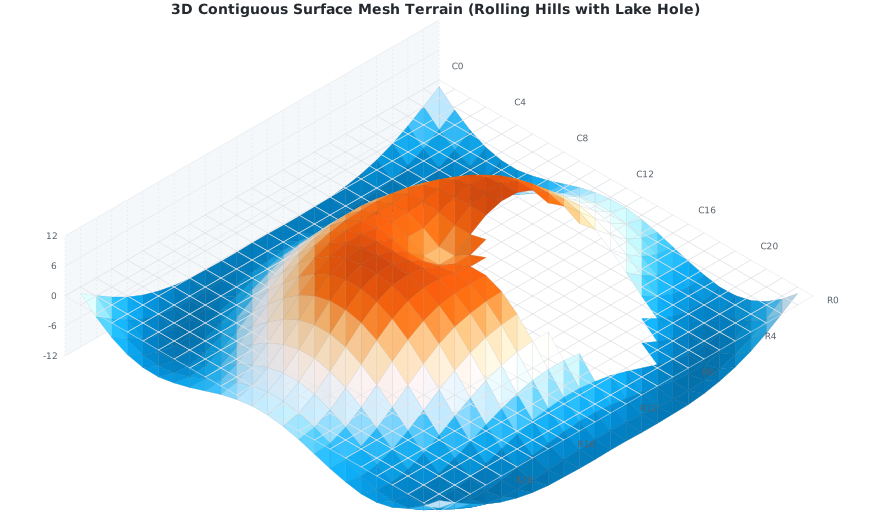
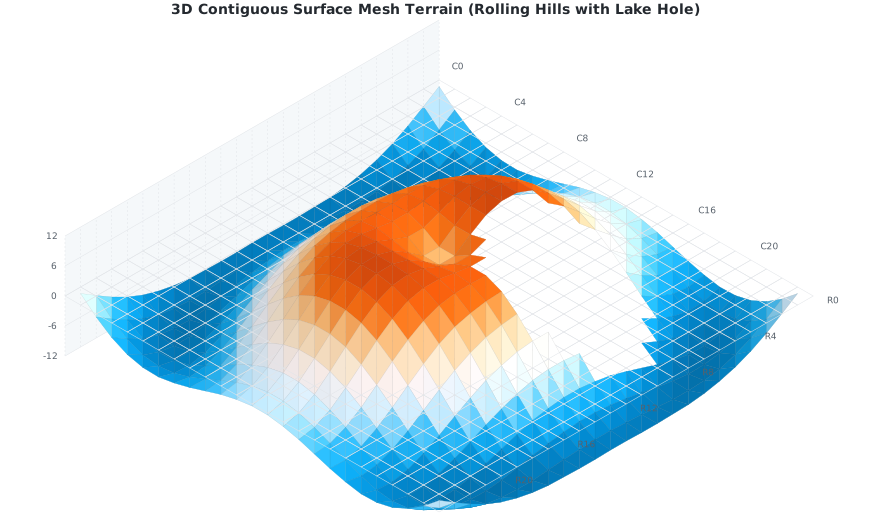
Continuous 3D Mesh Terrain
Connects adjacent matrix points into a cohesive 3D landscape with directional polygon shading and natural contour flow.
- Directional polygon shading for clear depth perception
- Automatic handling of missing and null values
- Custom color scales with linear or discrete threshold steps
// Floating Ribbons & Time Series
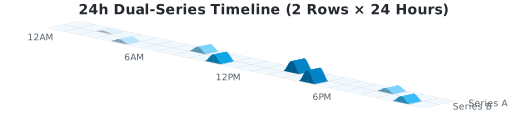
Floating Ribbons & Time Series
Visualizes parallel 24-hour sensor traces or calendar weeks with smooth Bezier ribbon curves.
- Independent height profiles per timeline row
- Optional height grid backdrop for metric orientation
- Lightweight SVG output ready for server and browser
A zero-dependency TypeScript library that turns 2D matrices and time series into isometric 3D landscapes rendered as pure, interactive SVG. Designed for sensor monitoring, environmental data, server metrics, and calendar periodicity.
Why Isometric Rather Than Flat?
Traditional flat heatmaps quickly hit human perceptual limitations: subtle variations between adjacent color shades are hard to distinguish with the naked eye. Users end up reading the legend instead of understanding the data.
mlc-isometric-heatmap gives data points a second expressive channel: height.
- Height and color encode the same value: Peaks, drops, and anomalies stand out by their contour immediately, even when hue differences are slight.
- Physical depth: Patterns across days of the week, hourly cycles, or seasonal trends emerge naturally in the isometric landscape.
- Interactive without JavaScript: Every cell contains accessible
<title>elements for screen readers and tooltips, alongside pure CSS hover effects embedded directly within the SVG.
Quickstart
Installation via npm
npm install mlc-isometric-heatmap
Usage in Browser or Node.js
import { HeatmapGrid } from 'mlc-isometric-heatmap';

// 2D matrix of values (e.g. 7 weekdays × 24 hours)
const data = [
  [12.4, 14.1, 15.0, 18.2, 21.5, 23.0, 20.1],
  [11.8, 13.5, 14.8, 17.9, 20.8, 22.4, 19.5],
  // ...further rows
];

const heatmap = new HeatmapGrid({
  data,
  shape: 'mesh',          // 'mesh' | 'prism' | 'cylinder' | 'ribbon' | 'flatribbon'
  colorScheme: 'sunset',  // 'sunset' | 'emerald' | 'sky' | 'coral'
  heightScale: 60,
  rowLabels: ['Mon', 'Tue', 'Wed', 'Thu', 'Fri', 'Sat', 'Sun'],
});

const svgString = heatmap.render();
Diverse Geometry Options
Depending on your dataset and density, the library provides several distinct shapes:
- Continuous 3D Mesh: A connected polygon terrain with directional lighting and shading. Ideal for dense sensor readings and continuous geographical or physical measurements.
- Floating Ribbons & Flat Ribbons: Smooth Bezier ribbons following each series timeline with drop shadows projected onto the base plane. Perfect for daily or weekly comparisons.
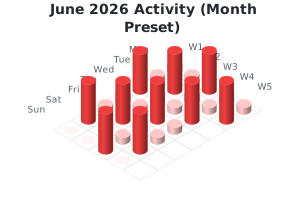
- Prisms & Cylinders: Distinct isometric bars with customizable bevels, radii, and spacing for calendar matrices and hourly blocks.
- Height Grid (Scale Wall): An optional isometric backdrop with horizontal scale lines and numeric labels for clear quantitative orientation.
Interactive Online Handbook
For in-depth documentation and design patterns, explore the comprehensive online handbook:
👉 Read the interactive handbook on mlcgo.eu
The handbook covers 7 chapters with 45 interactive live examples:
- Chapter 1: Why Isometric? Foundations and projection math
- Chapter 2: The First Heatmap — Configuration, scaling, and orientation
- Chapter 3: Shapes — Comparing prisms, cylinders, ribbons, and 3D meshes
- Chapter 4: Colors & Gradients — Discrete palettes and continuous SVG gradient interpolation
- Chapter 5: Time Series — Calendar grids, 24-hour timelines, and recurring intervals
- Chapter 6: Gaps in the Grid — Handling missing entries, sensor outages, and null values
- Chapter 7: Gallery — Real-world scenarios from indoor climate to solar generation
Technical Highlights
- Pure Vector SVG: Crisp and sharp across mobile screens, Retina displays, 4K monitors, and print exports.
- Zero Dependencies: No Canvas, no WebGL, no D3 or Three.js dependencies. Fast, lightweight, and self-contained.
- Server and Browser: Runs seamlessly in the browser, in SSR frameworks (SvelteKit, Next.js, Nuxt), or in backend Node.js microservices for report and PDF generation.
- Open Source: MIT licensed on GitHub.