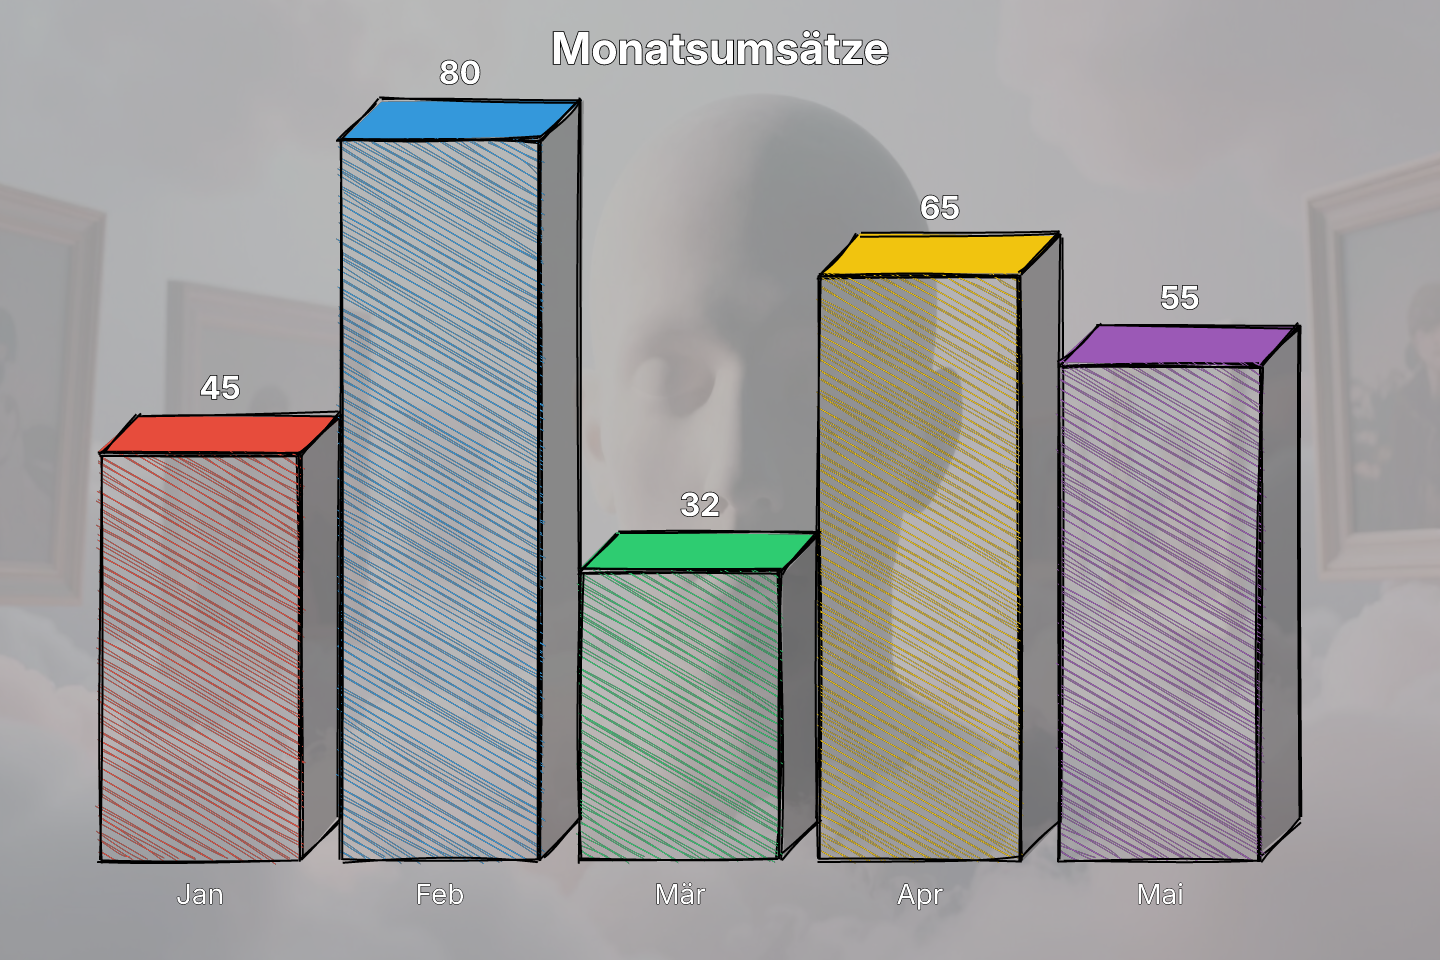
Hand-gezeichnetes Balkendiagramm über Foto (mlcrough + Bild)
Hand-gezeichnetes 3-D-Balkendiagramm über einem Foto-Hintergrund — die skizzige Optik, mit der trockene Zahlen plötzlich angeschaut werden. Ideal für Pitch-Decks, Social-Media-Posts mit Datenbezug, Dashboard-Hero-Karten oder überall dort, wo ein Excel-Screenshot zu corporate wirken würde. Jeder Balken ist ein grob skizziertes Volumen mit schraffierten Fronten, Titel und Labels stehen sauber darüber.
BG
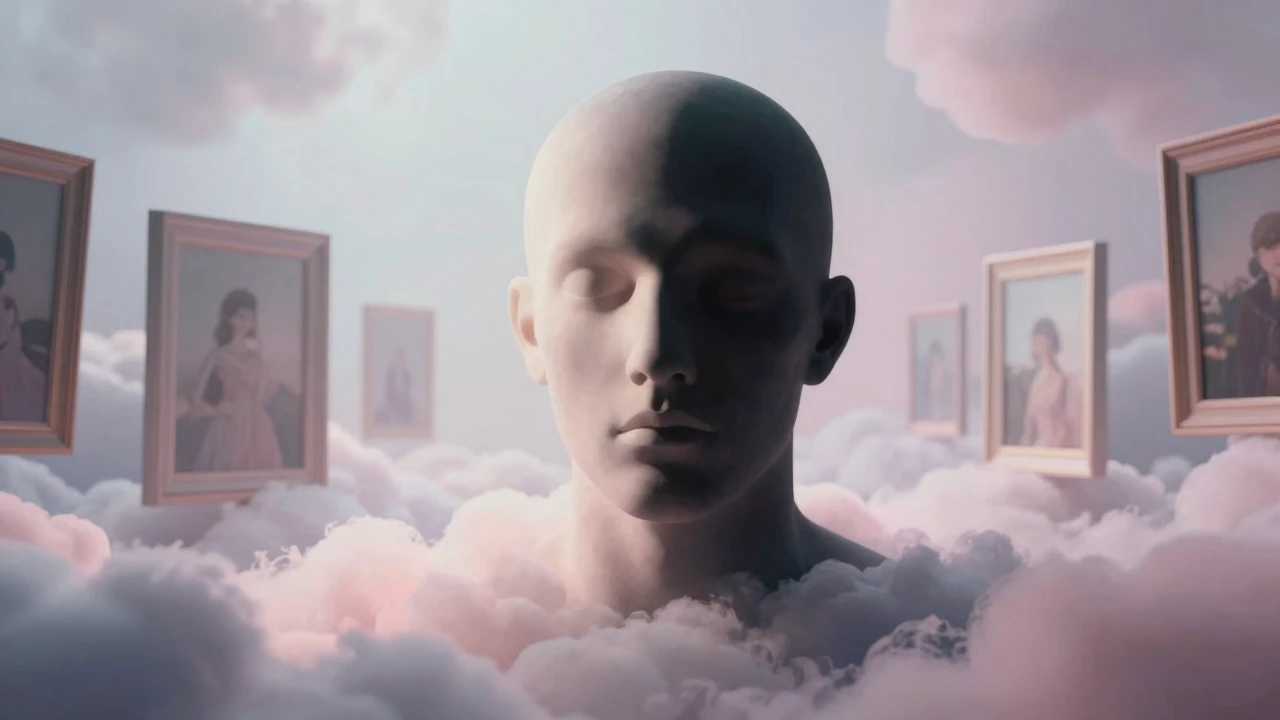
Hand-drawn bar chart over photo
JavaScript
// Hand-drawn 3-D bar chart, optionally laid over a raster background.
// Drives the `mlcrough` engine extension via Engine.getMlcrough().
//
// Drop an image into the BG slot to see the canonical OpticScript pattern
// "image + vector in one ImageHandle". Without a BG image, the chart
// renders on a flat dark background.
// demo_rough_barchart.js
//!INPUT: BG
//!OUTPUT: OUTPUT
//!PARAM: TITLE:string=Monatsumsätze
//!PARAM: WIDTH:integer=720,min=400,max=1600
//!PARAM: HEIGHT:integer=480,min=300,max=1200
//!PARAM: SCALE:number=2,min=1,max=4,step=0.5
//!PARAM: BG_DIM:number=0.55,min=0,max=1,step=0.05
//!PARAM: SEED:integer=1,min=0,max=1000000
// SEED: gleiche Zahl → gleiches Rauschen (reproduzierbar); 0 → jedes Mal neu.

const W = Math.round(WIDTH * SCALE);
const H = Math.round(HEIGHT * SCALE);

// 1. Background — user-supplied photo if BG is wired up, otherwise a
//    flat dark canvas so the demo runs out-of-the-box.
let bg;
if (typeof BG === "string" && BG) {
  bg = Engine.loadImage(BG).resize(W, H);
  if (BG_DIM > 0) {
    const dim = Engine.createImage(W, H, "#000000");
    bg.blend(dim, BG_DIM, BlendMode.Normal);
  }
} else {
  bg = Engine.createImage(W, H, "#1f2933");
}

// 2. Build the bar chart with a transparent background.
const data = [
  { label: "Jan", value: 45, color: "#e74c3c" },
  { label: "Feb", value: 80, color: "#3498db" },
  { label: "Mär", value: 32, color: "#2ecc71" },
  { label: "Apr", value: 65, color: "#f1c40f" },
  { label: "Mai", value: 55, color: "#9b59b6" },
];
const r = Engine.getMlcrough({ width: WIDTH, height: HEIGHT, seed: SEED || undefined });

const padding = 50;
const depth = 20;
const barGap = 20;
const chartW = WIDTH - padding * 2 - depth;
const chartH = HEIGHT - padding * 2 - depth;
const barW = chartW / data.length - barGap;
const maxVal = Math.max(...data.map(d => d.value));

data.forEach((d, i) => {
  const x = padding + i * (barW + barGap);
  const y = HEIGHT - padding - (d.value / maxVal) * chartH;
  const baseline = HEIGHT - padding;

  r.polygon([
    [x, y],
    [x + depth, y - depth],
    [x + barW + depth, y - depth],
    [x + barW, y],
  ], { fill: d.color, fillStyle: "solid" });

  r.polygon([
    [x + barW, y],
    [x + barW + depth, y - depth],
    [x + barW + depth, baseline - depth],
    [x + barW, baseline],
  ], { fill: "rgba(0,0,0,0.25)", fillStyle: "solid" });

  r.rectangle(x, y, barW, baseline - y, {
    fill: d.color, hachureAngle: 60, hachureGap: 4,
  });

  r.raw(`<text x="${x + barW / 2}" y="${baseline + 22}" text-anchor="middle" font-family="sans-serif" font-size="14" fill="#fff" stroke="#000" stroke-width="0.5" paint-order="stroke">${d.label}</text>`);
  r.raw(`<text x="${x + barW / 2 + depth / 2}" y="${y - depth - 8}" text-anchor="middle" font-family="cursive, sans-serif" font-weight="bold" font-size="16" fill="#fff" stroke="#000" stroke-width="0.7" paint-order="stroke">${d.value}</text>`);
});

r.raw(`<text x="${WIDTH / 2}" y="32" text-anchor="middle" font-family="cursive, sans-serif" font-size="22" font-weight="bold" fill="#fff" stroke="#000" stroke-width="0.8" paint-order="stroke">${TITLE}</text>`);

// 3. Composite vector over the background.
bg.blend(r.toImage(SCALE), 1.0, BlendMode.Over);
bg.save(OUTPUT);

// © 2026 Michael Lechner · mlc OpticScript · https://mlcgo.eu · Elastic License 2.0