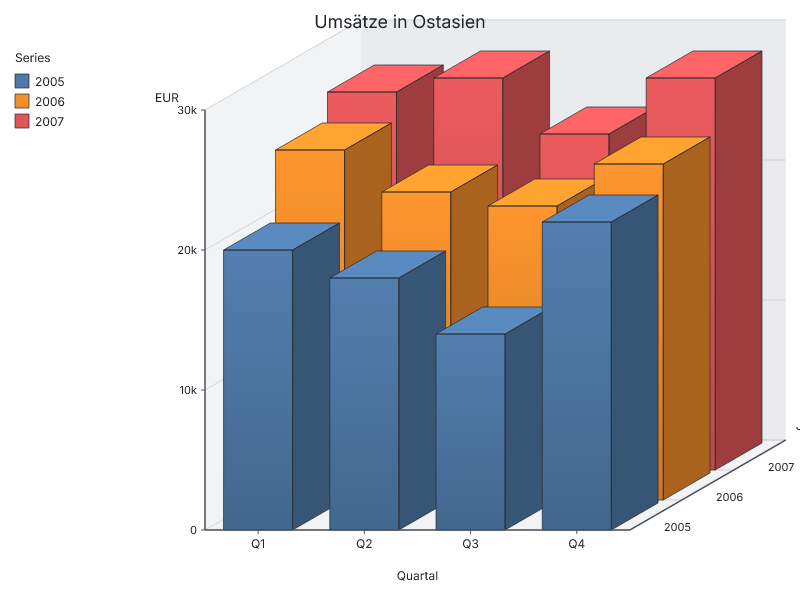
3-D bar chart with stair-stepped Z-axis
Drives the `barchart3d` engine extension. Pass `categories` (X-axis labels), one or more `series` (each `{label, values[]}`), and the chart renders a fully-styled cuboid bar chart — three flat-shaded faces per bar (front gradient + lighter top + darker right side), Tableau-10 colour palette, optional Y/Z grid, legend, and stair-stepped Z-axis labels along the receding edge. Pure JS, no Rust changes — uses canvas paths, linear gradients, and oblique projection.
3-D bar chart
JavaScript
// 3-D bar chart with categories, multiple series and a stair-stepped
// Z-axis — drives the `barchart3d` engine extension.
// demo_barchart3d.js
//!NOIMAGE
//!OUTPUT: OUTPUT
//!PARAM: TITLE:string=Umsätze in Bayern
//!PARAM: GLOSSY:bool=true
//!PARAM: WIDTH:integer=800,min=400,max=1600
//!PARAM: HEIGHT:integer=600,min=300,max=1200
//!PARAM: LEGEND:enum(left|top|right|bottom|none)=right
//!PARAM: SERIES_GAP:number=0,min=0,max=0.9,step=0.05

// Three series along Z (years), four categories along X (quarters).
// The data exactly mirrors the classic Excel "3D-Balkendiagramm"
// example so the result is directly comparable to the spreadsheet
// version. Tweak `series` to feed your own data — every series must
// supply exactly one value per category.
const img = Engine.barChart3D({
  title: TITLE,
  categories: ["Q1", "Q2", "Q3", "Q4"],
  series: [
    { label: "2005", values: [20000, 18000, 14000, 22000] },
    { label: "2006", values: [25000, 22000, 21000, 24000] },
    { label: "2007", values: [27000, 28000, 24000, 28000] },
  ],
  yLabel: "EUR",
  xLabel: "Quartal",
  zLabel: "Jahr",
  width: WIDTH,
  height: HEIGHT,
  glossy: GLOSSY,
  legend: LEGEND,
  seriesGap: SERIES_GAP,
});
img.save(OUTPUT);

// © 2026 Michael Lechner · mlc OpticScript · https://mlcgo.eu · Elastic License 2.0