Chapter 1: Two ways to draw the same chart
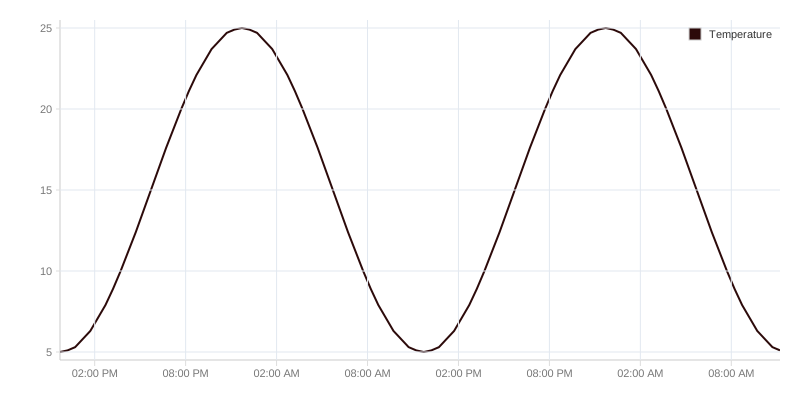
MLTimeGraph exists twice. Once as a TypeScript library that draws in the browser, and once as a Go library that renders SVG on the server — no DOM, no browser, no headless anything.
That is not duplicated work. It is the answer to two different questions.
When the server draws
A report that goes out as PDF. An email with the day's readings. A dashboard in an environment where JavaScript is not allowed. An image that should look the same in ten years.
In all of those the chart is a file, not a program. The Go side delivers exactly that: an SVG string, produced from a JSON description, in milliseconds, without a browser starting anywhere.
When the browser draws
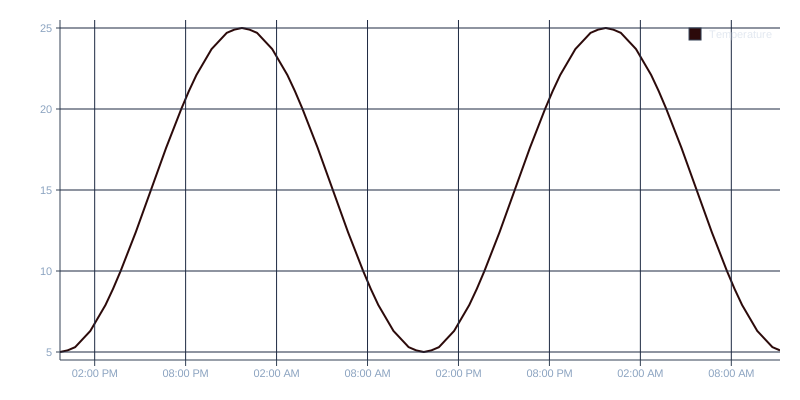
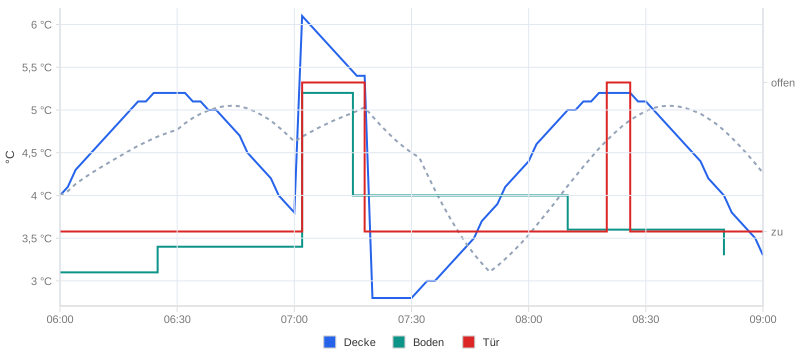
The moment somebody wants to look into the data. Zoom, pan, read a value under the cursor, compare two ranges. An image cannot do that, and trying leads to images you click, which load other images.
The demo below is running for real — move the pointer across the curve, drag a range, scroll to zoom.
Why both are the same chart
The Go side is a port of the TypeScript one, not a separate project with a similar result. The same axis calculations, the same time formatting, the same thresholds. A configuration that produces a given picture in the browser produces the same picture on the server.
In practice: you can design a view interactively and then ship it server-side without describing it a second time.
The versions of the two halves are kept in step on purpose — ml-time-graph on
npm and the Go module tag go-time-graph/vX.Y.Z carry the same number, so that
"the same release" stays a checkable statement.