Chapter 6: Gallery
What did not fit into the chapters. Running demos above, server-rendered images
below — the same library, two output paths.
Each demo starts only once you reach it; until then it costs nothing. All of
them share a single bundle that the browser loads once.
Running demos
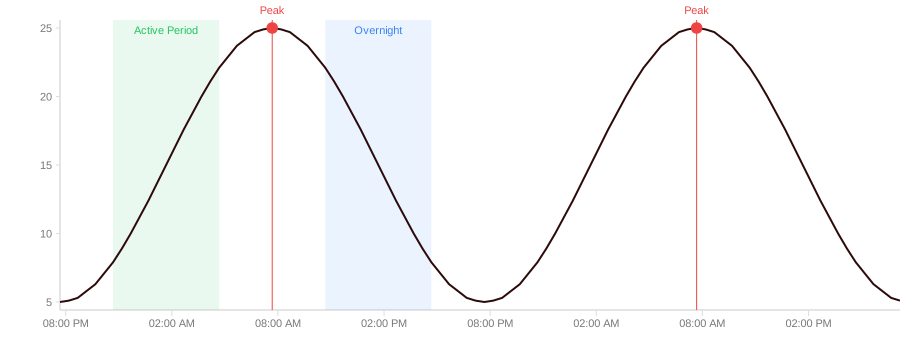 Annotations: markers and highlighted ranges — open the live demo
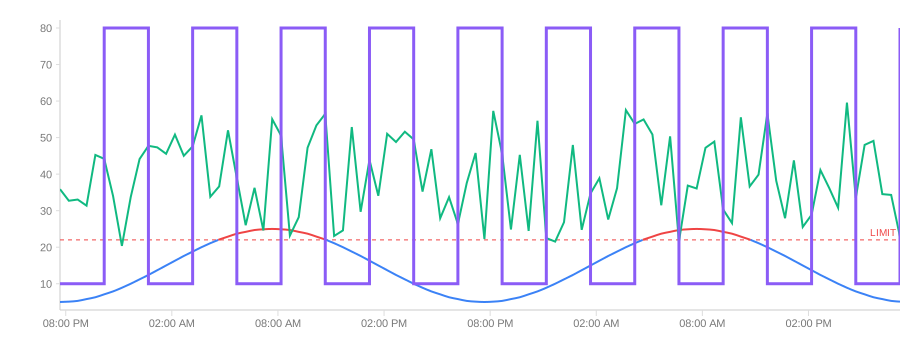 Mixed systems in one monitor — open the live demo
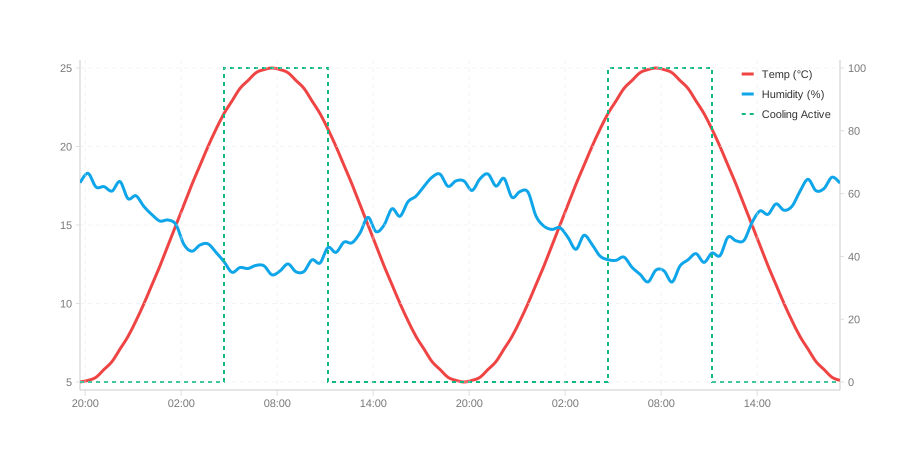 Environmental dashboard: several systems — open the live demo
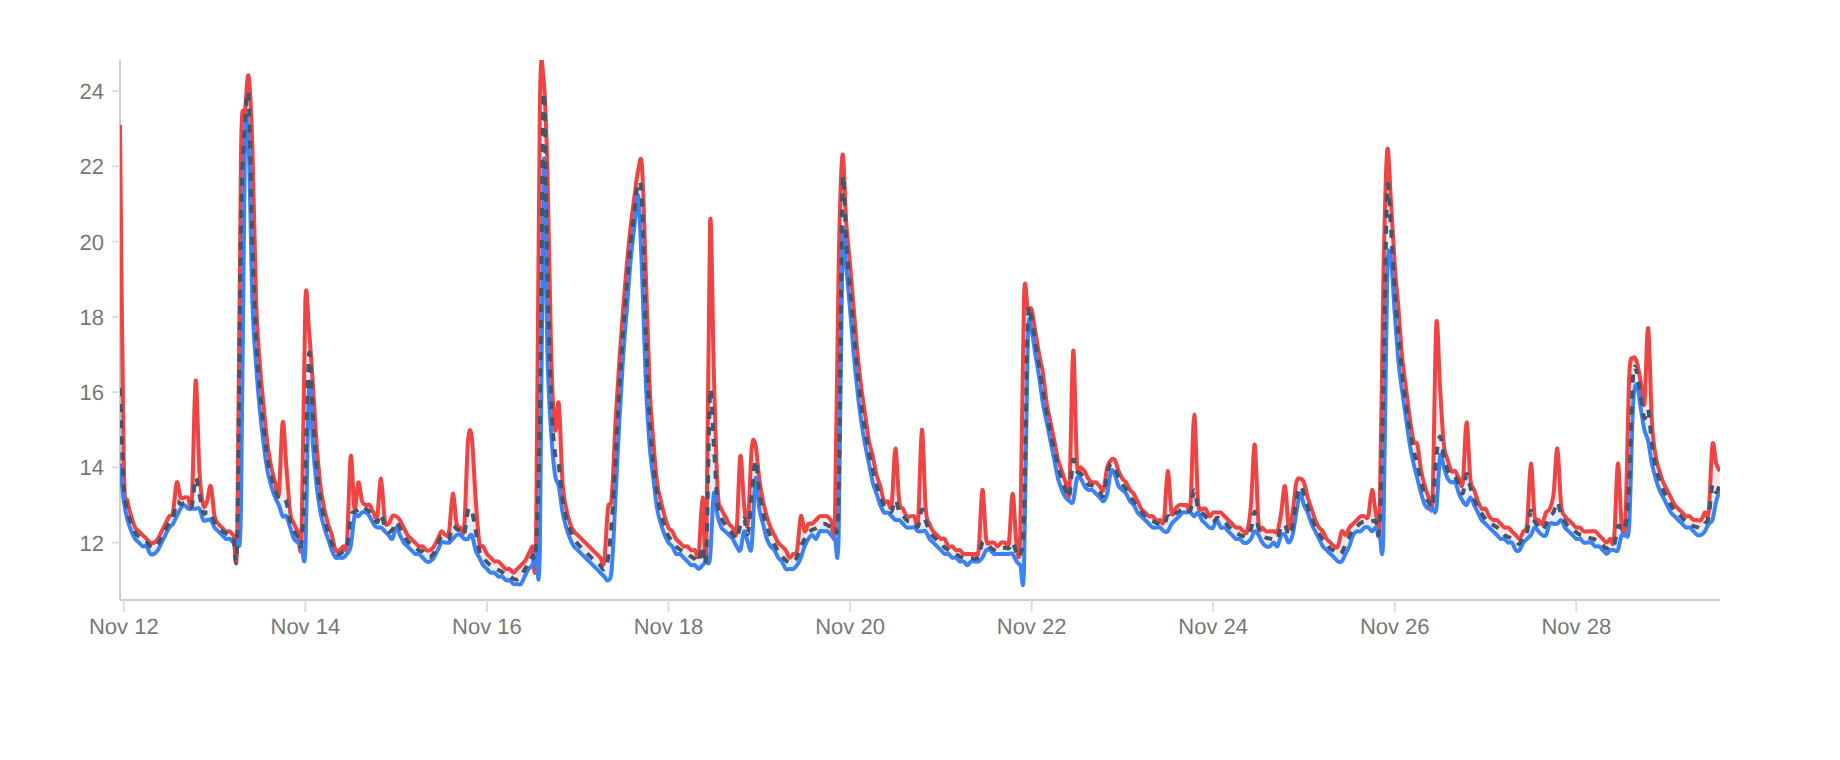 Refrigeration unit — hourly minimum, mean and maximum — open the live demo
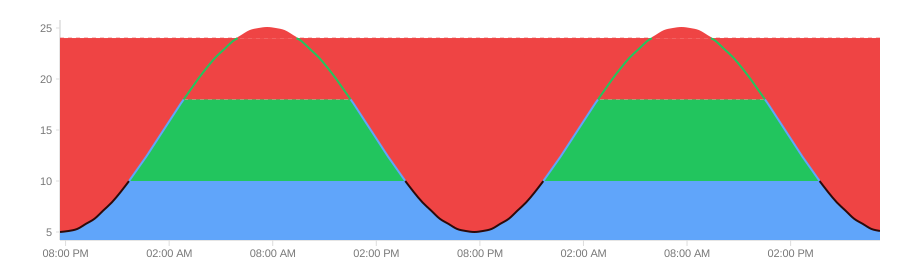 Hatched zones between thresholds — open the live demo
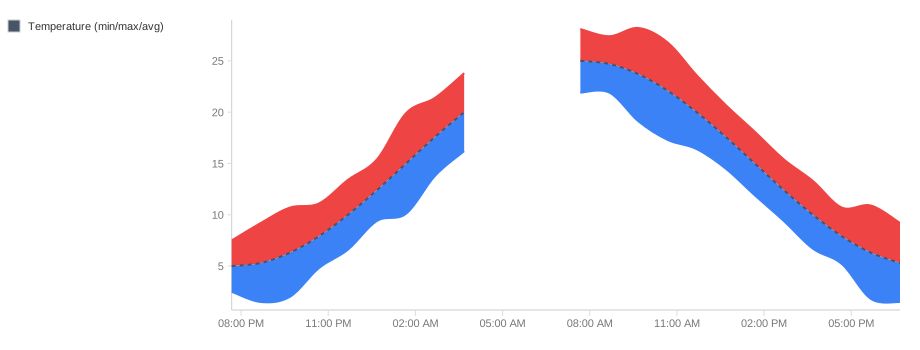 Minimum, maximum and mean as a band — open the live demo
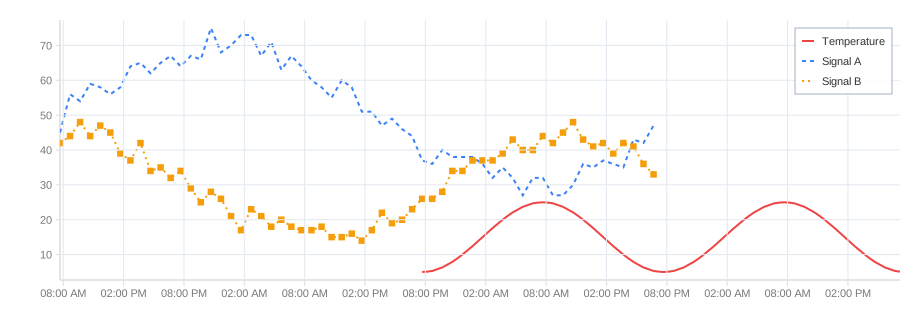 Legend: a panel, and entries you can click — open the live demo
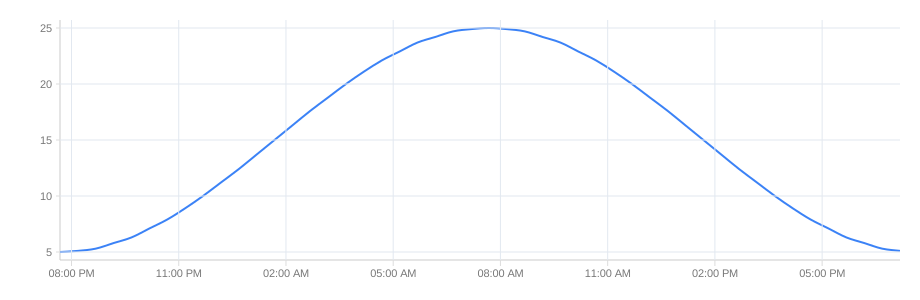 Style editor — open the live demo
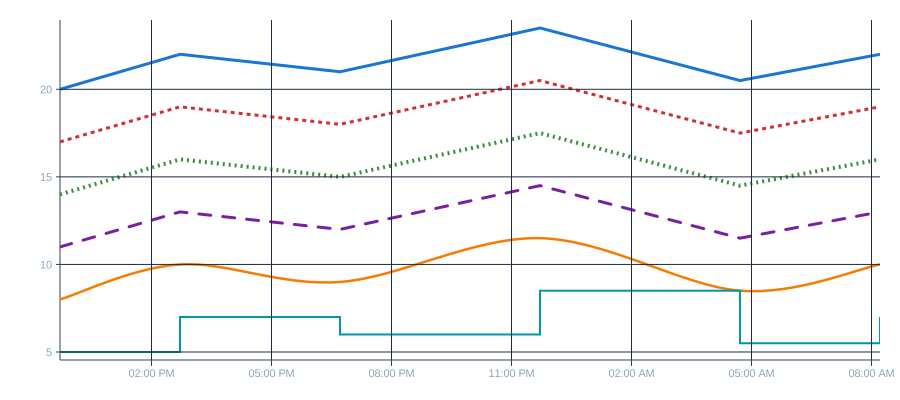
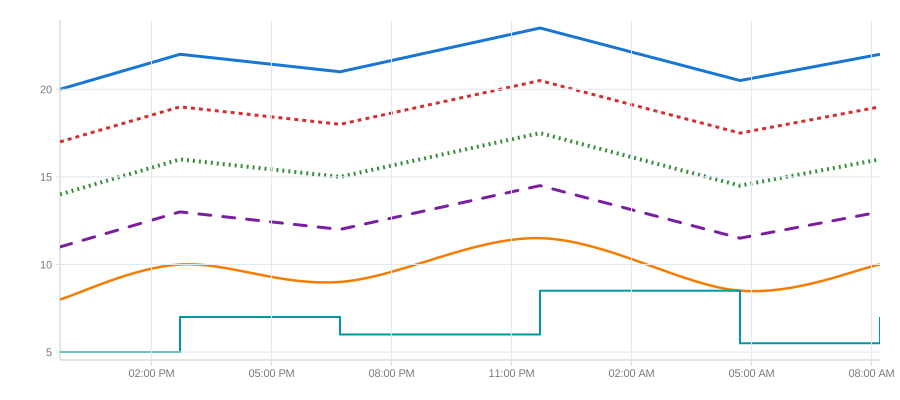
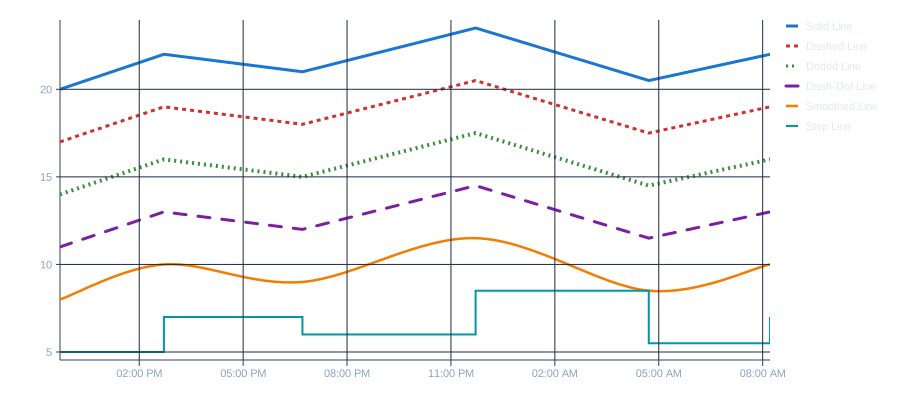
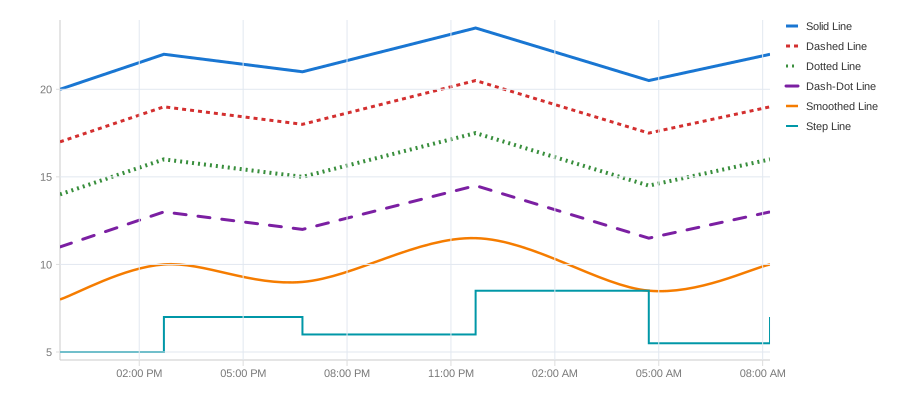
Rendered on the server
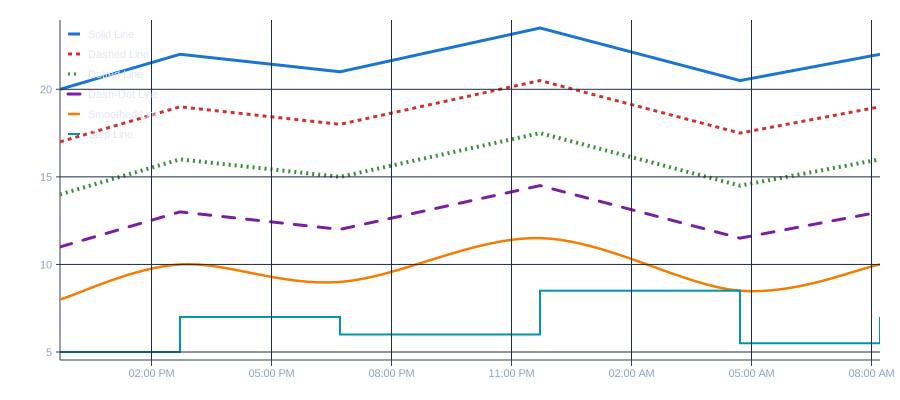
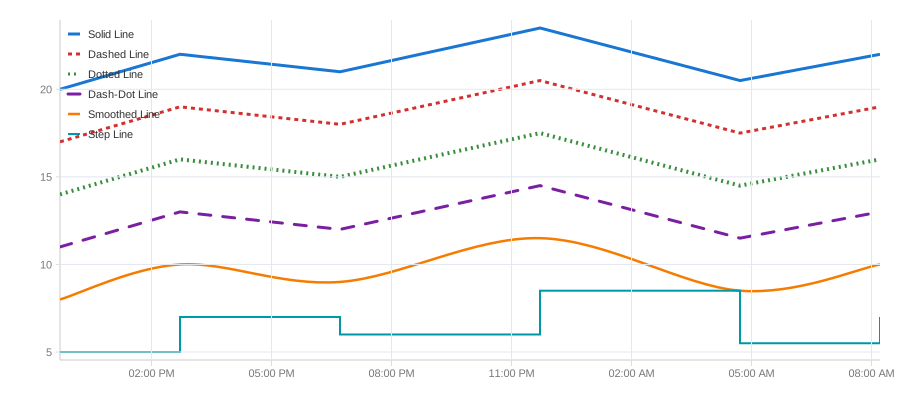
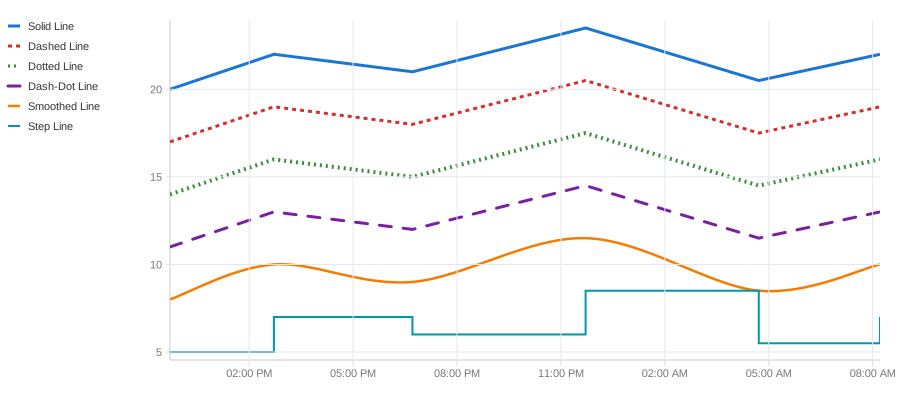
Legend inside, left
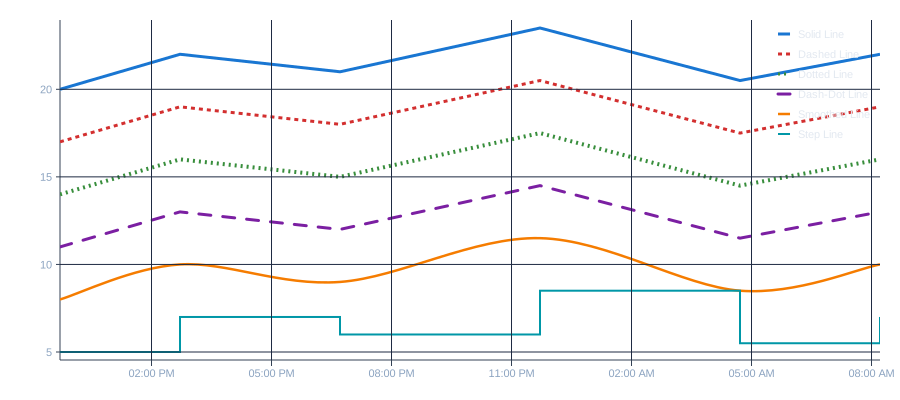
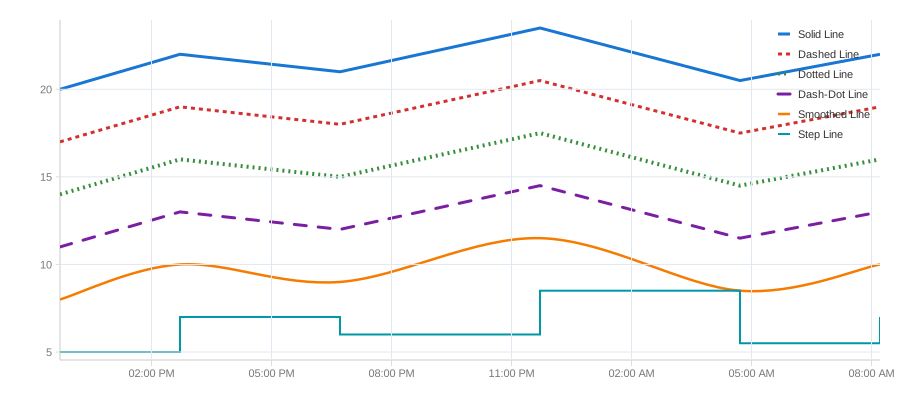
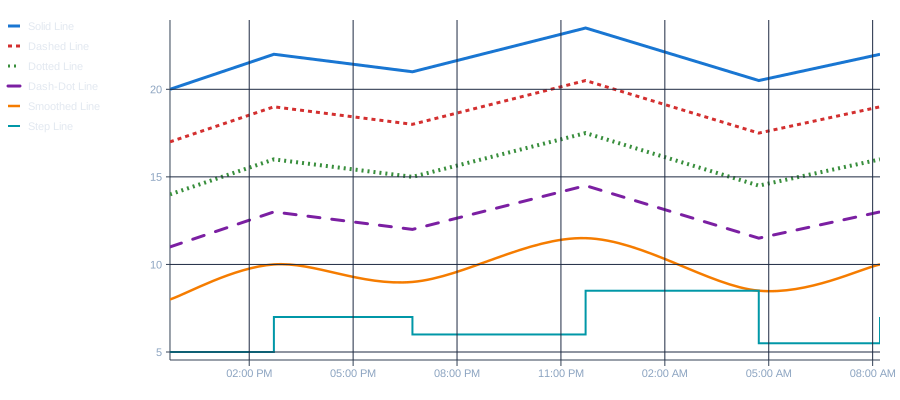
Legend inside, right
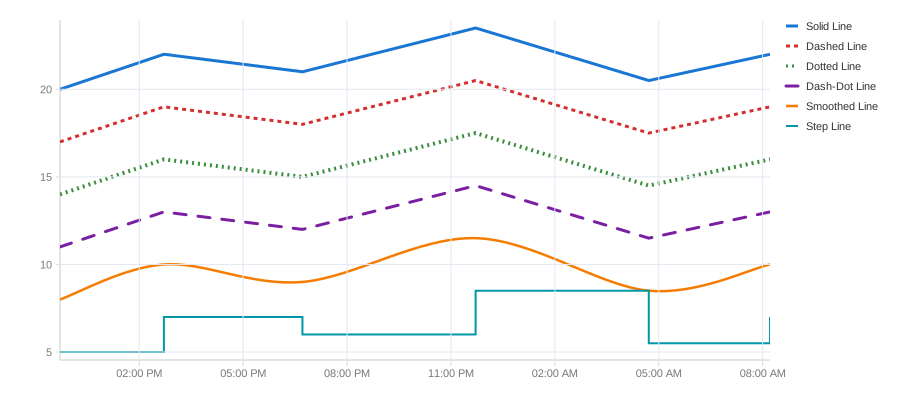
Legend outside, left
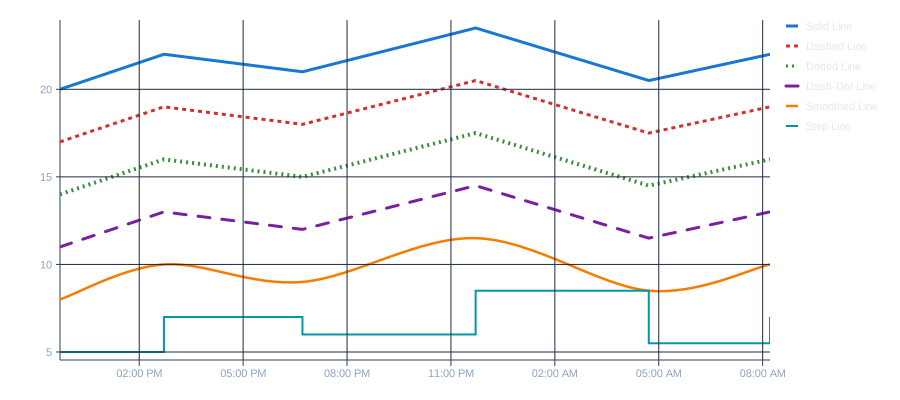
Legend outside, right
Legend as a separate block
Line types
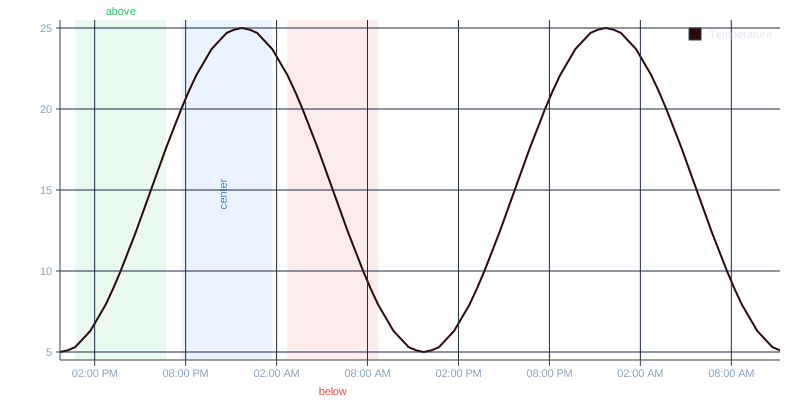
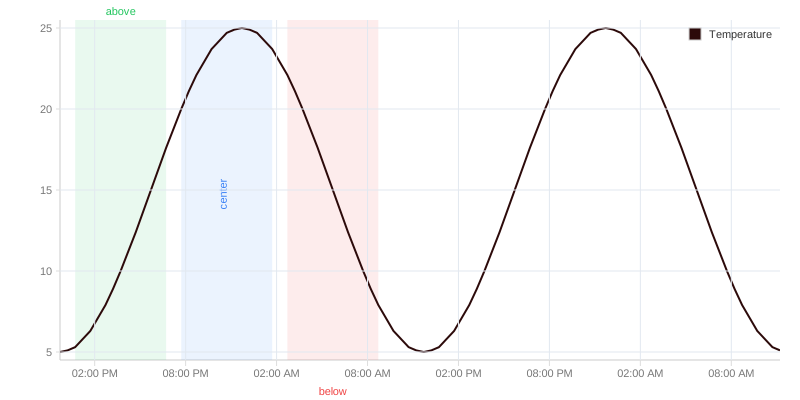
Highlighted sections