Chapter 5: Rendering on the server
go get gitlab.com/mlc0911/mlctimegraph/go-time-graphThe Go side has three uses, and the choice depends on where the image is born.
As a library
Inside your own service, when the chart is part of a larger answer — a report, a page, an attachment.
Two things matter when the SVG ends up next to others — several charts in one
HTML page or one report. Set idPrefix in the options, as in the browser, and
the renderer's own ids (gradients, patterns, clip paths in <defs>) with
SetIDPrefix:
r := renderer.NewSVGRenderer("800", "400")
r.SetIDPrefix(opts.IDPrefix)   // e.g. "cellar"
And the evaluation that belongs to the picture runs here too:
analyze.ComputeLimitExcursions gives the same episodes and the same time
outside the limits as computeLimitExcursions in the browser — so the screen
and the PDF report the same duration.
In Go, a value axis gets its own number format in code, since a function cannot travel as
JSON. YAxisConfig.Format is the counterpart of axes.y[].format in the browser:
opts.Axes.Left.Format = func(v float64) string { return fmt.Sprintf("%.1f °C", v) }As a command-line tool
graph-cli -in config.json -out chart.svg
graph-cli -in config.json -out chart.svg -bg white
For work that runs on a schedule: the daily report at six, the weekly picture on
Monday. -bg white sets a background — needed as soon as the image goes into a
PDF or an email, where transparency can turn into black on black.
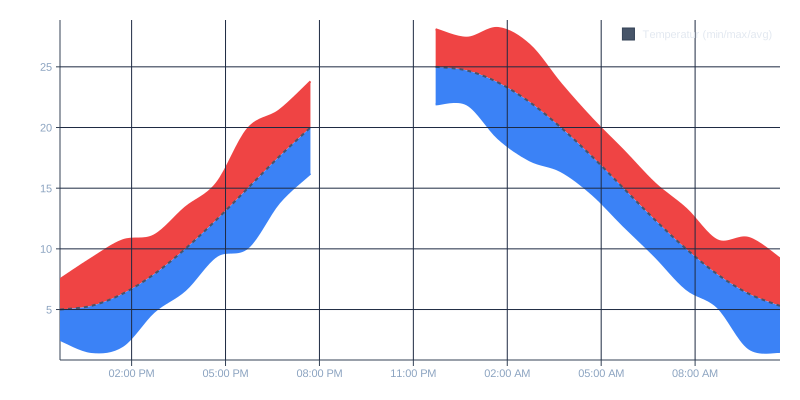
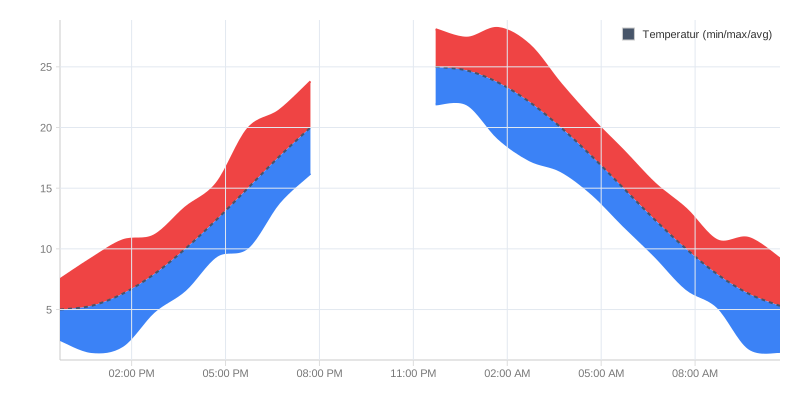
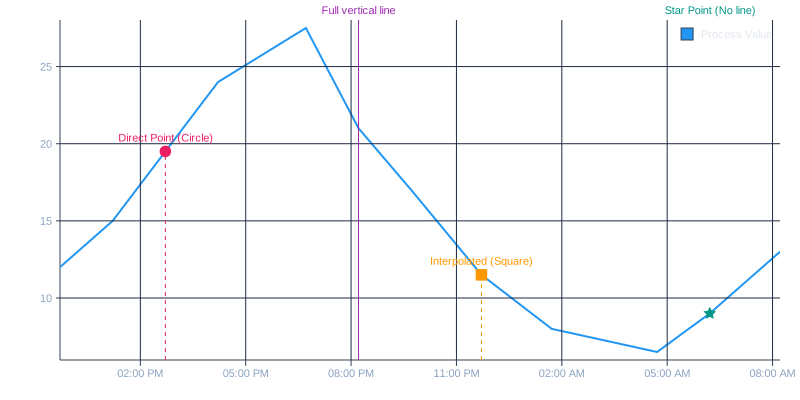
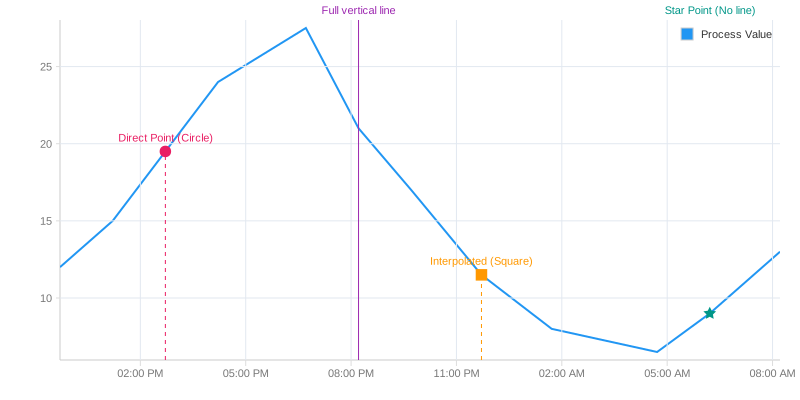
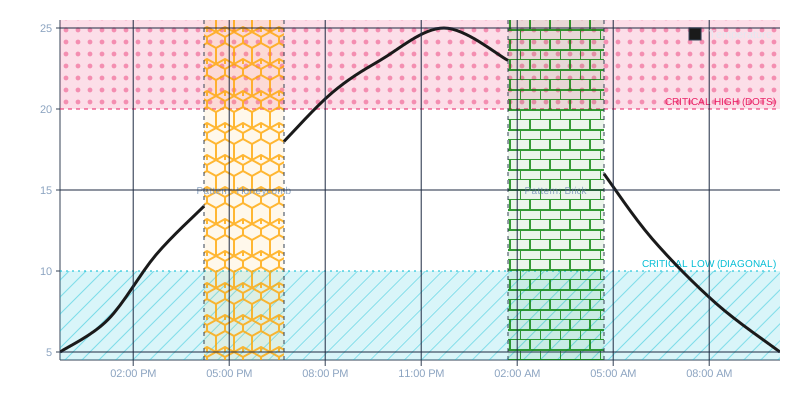
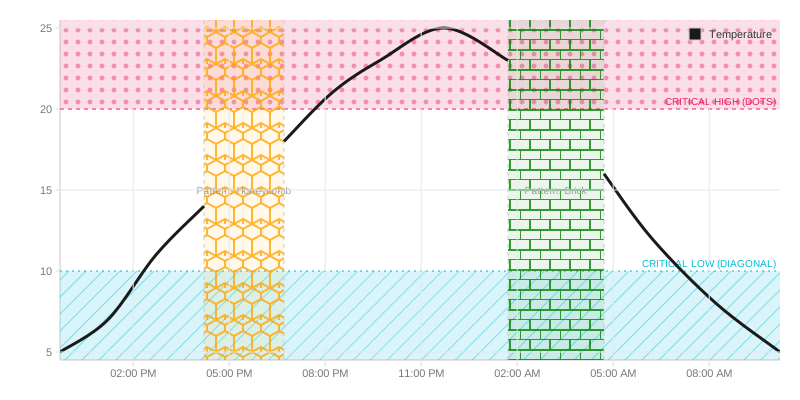
Every static illustration in this manual was produced this way.
Put the repeating part in its own file
As soon as several reports exist, part of the description repeats: dimensions,
axes, legend, colours. Copying that part into every file means changing it in
twelve places one day and forgetting one. -with layers it on top instead:
graph-cli -in readings.json -with house-theme.json -out chart.svgThe flag is repeatable and the later layer wins, so a house style can be extended per project and per chart:
graph-cli -in readings.json -with house-theme.json -with report.json -out chart.svgThe rule behind it is one sentence: objects are merged, everything else is replaced. A theme that only sets the grid leaves the axis label from the data alone:
{
  "width": 1000,
  "axes": {
    "x":    { "grid": { "major": { "color": "#eeeeee" } } },
    "left": { "grid": { "major": { "color": "#eeeeee" } } }
  },
  "legend": { "show": true, "position": "outside-right" }
}
"Everything else" includes arrays, and that is where care is needed: a layer
carrying series replaces your readings instead of styling them. That is
deliberate — if it appended, a theme with a single line style would turn one
curve into two, and nobody would guess why. The CLI warns when an overlay sets
series.
mtg-pdf takes the same flag. There it applies to options only: draw commands
are geometry already computed, and no theme can be laid over them.
In the browser, mergeOptions does the same:
import { mergeOptions, MLTimeGraph } from 'ml-time-graph';

new MLTimeGraph(mergeOptions(houseTheme, readings));
Not to be confused with { ...houseTheme, ...readings } — the spread is
shallow. An axes in the second object replaces the entire axes of the
first, grid, ticks and all.
As an HTTP service
graph-server accepts the same JSON description and answers with SVG. Sensible
when several applications need charts and none of them should take on a Go
dependency.
The description
All three read the same structure — the same one the TypeScript side accepts in the browser. A chart you designed interactively becomes a JSON file and runs through the server unchanged.
When the description is wrong
A typo in a JSON file used to vanish without a trace: "lnie": "dashed" was
ignored, the threshold came out solid, and nobody knew why. Since 1.17 all three
entry points check every field against the description and refuse what they do
not know:
invalid options: legnd: unknown field (did you mean "legend"?);
  thresholds[0].lnie: unknown field (did you mean "line"?)
Every mistake in one message, each with its path, with a suggestion where a
known name is close. Missing required fields — a series without name or
data, a threshold without name — are reported the same way. The CLI exits
with an error, graph-server answers 400, and chart.LoadOptions returns
the error to your code.
And what is not an error
Some descriptions are complete and still not what was meant: a threshold name with a typo
in colorByThresholds, a fill bound that names a series that does not exist, side on a
fill that ignores it. The chart is drawn anyway, just without the zone. Both libraries
report such cases on request, with the same text:
for _, w := range chart.NewMLTimeGraph(opts).Warnings() {
    log.Println(w) // series 0 colorByThresholds names unknown threshold "mxa"
}
In the browser it is chart.warnings(). Thresholds are looked up by id, and by name only
when there is no id, just as when drawing: a threshold with an id is not found by its
name, and the warning says so.
What the server cannot do
Anything anyone clicks. No zoom, no tooltip, no selection. If you need that, you need the browser — and if you do not, the server saves you a runtime, a class of failure and a page load.